Monitoring Kubernetes Cluster with Kube-Prometheus-Stack
In the wild world of container orchestration, Kubernetes is the undisputed champ. Now, imagine your Kubernetes cluster as a bustling city—running apps, ensuring security, and doing all sorts of tech acrobatics.
But, it's like working in the dark without proper monitoring. Sure, you can peek into the terminal, but imagine having real-time, easy-to-read dashboards for a smoother cluster life. Lazy as I am, I found the absolute laziest way to set up monitoring for my cluster.
So, buckle up as we take a laid-back stroll through deploying the Kube-Prometheus-Stack using Helm. We'll unravel the magic behind monitoring in a Kubernetes setup. Ready? Let's dive in. 🚀
Prerequisites
k3scluster or any Kubernetes provider- Ingress, I am using
nginx - helm >= 3
Why monitor at all?
Keeping an eye on Kubernetes clusters isn't just a fancy add-on—it's the secret sauce for top-notch performance, catching problems before they party too hard, and planning resources like a seasoned strategist.
Think of it as having your cluster on a fitness regime—you track CPU usage, memory habits, and network vibes. Why? So you can tackle bottlenecks, allocate resources like a champ, and dodge downtime bullets. It's not just about fixing issues; it's about fixing them before they're even issues.
Plus, monitoring spills the tea on how your resources are vibing, helping you plan capacity and make scaling decisions like a boss. And don't even get me started on the security dance—it's the guardian angel of your cluster, making sure it's compliant and secure.
Oh, and did I mention it's like a time machine for your data? Historical metrics for trend analysis—hello, crystal ball of optimization! Monitoring: it's not just a tool; it's a way of Kubernetes life. 🌟
The Kube-Prometheus-Stack
This is your sidekick in the mission of easy-breezy cluster monitoring. With a collection of Kubernetes manifests, Grafana dashboards, Prometheus rules, and a script or two, it turns the usually complex task into a walk in the Kubernetes park. It's like having your personal monitoring maestro, orchestrating the whole show. No more headaches—just smooth, end-to-end Kubernetes monitoring, wrapped up with neat documentation.
We will be using the official helm chart for kube-prometheus-stack and I am tailoring things to my lazy brilliance—max output, minimum effort. Now, create a stack-conf.yml file, remember to use your own FQDN and password
prometheus:
  prometheusSpec:
    podMonitorSelectorNilUsesHelmValues: false
    serviceMonitorSelectorNilUsesHelmValues: false
    resources:
      limits:
        cpu: 1000m
        memory: 6Gi
      requests:
        cpu: 500m
        memory: 2Gi

prometheus-node-exporter:
  hostRootFsMount:
    enabled: false

grafana:
  adminUser: "admin"
  adminPassword: "password"
  defaultDashboardsTimezone: "Asia/Dhaka"
  ingress:
    enabled: true
    ingressClassName: "nginx"
    hosts:
      - example.com
  persistence:
    enabled: true
    type: sts
    storageClassName: "local-path"
    accessModes:
      - ReadWriteOnce
    size: 10Gi
    finalizers:
      - kubernetes.io/pvc-protection
stack-conf.yml
Alright, picture this: Prometheus is like that superhero who, in a different part of the city, can't see the troubles brewing in another neighborhood. Why? Because, by default, when it's running in its own space, it can't discover what's happening in other parts (namespaces) of the city (your Kubernetes cluster).
But fear not, our superhero has a nifty trick up its sleeve. We just tweak a setting, serviceMonitorSelectorNilUsesHelmValues flag. We're basically telling Prometheus, "Hey, broaden your vision, look into other neighborhoods too!" And just to make sure it's crystal clear, we disable the same behavior for PodMonitors with the podMonitorSelectorNilUsesHelmValues set to false.
Voila! Prometheus is now the all-seeing hero, vigilant in every corner of your Kubernetes city. Ready to install with following steps:
helm repo add prometheus-community https://prometheus-community.github.io/helm-charts
helm repo update
Add the chart repository
helm upgrade --install prometheus prometheus-community/kube-prometheus-stack \
    --namespace monitoring --create-namespace \
    --values ~/stack-conf.yml
Idempotent version, will install or upgrade if exists
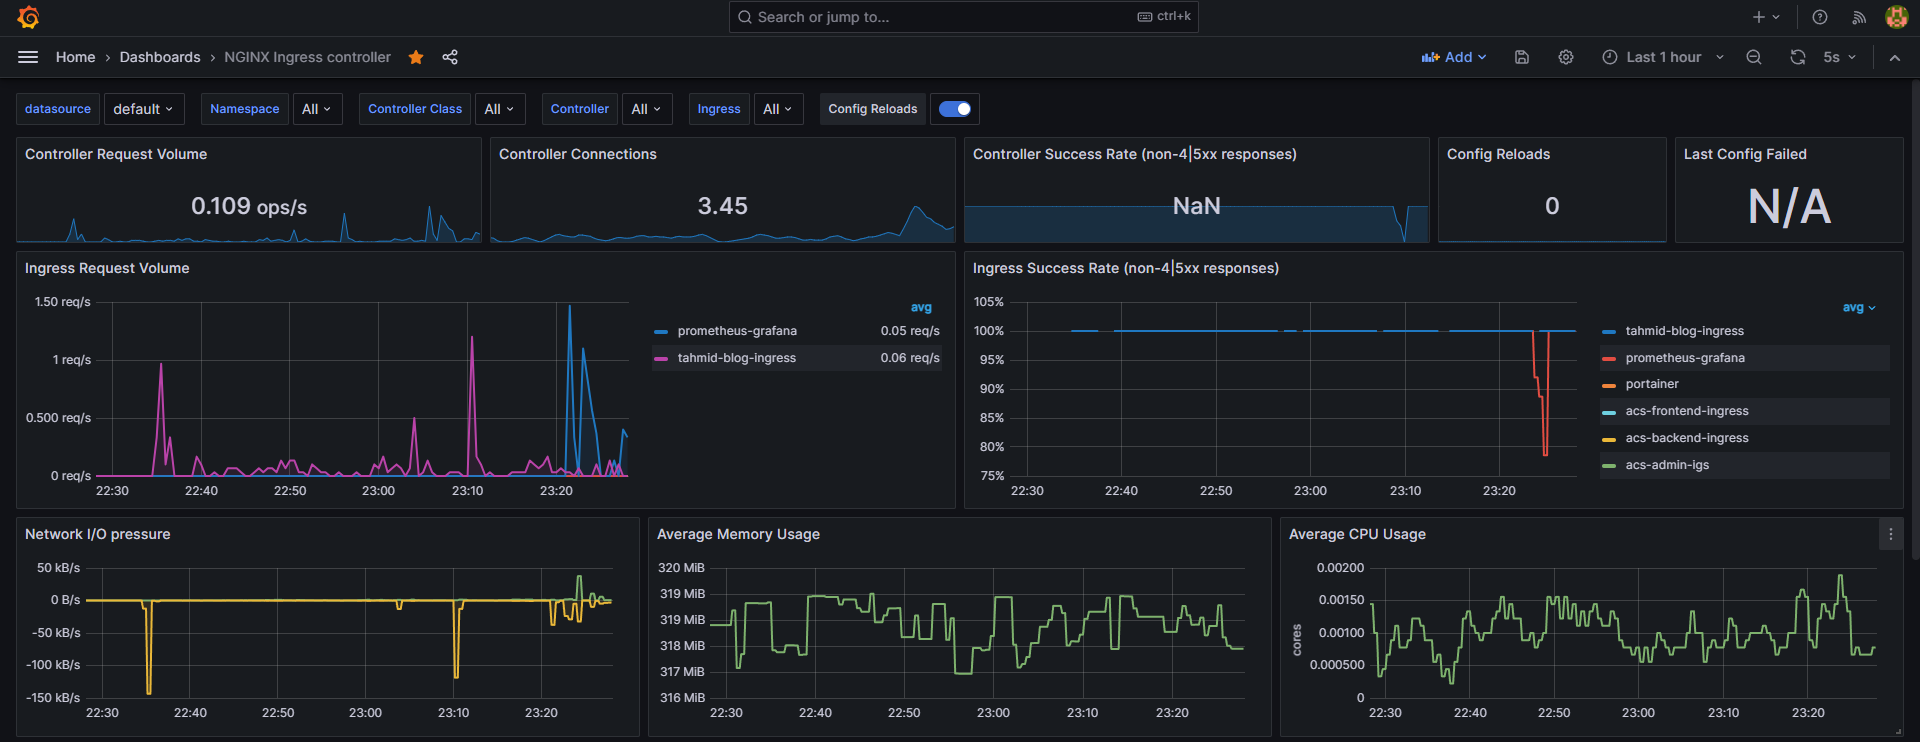
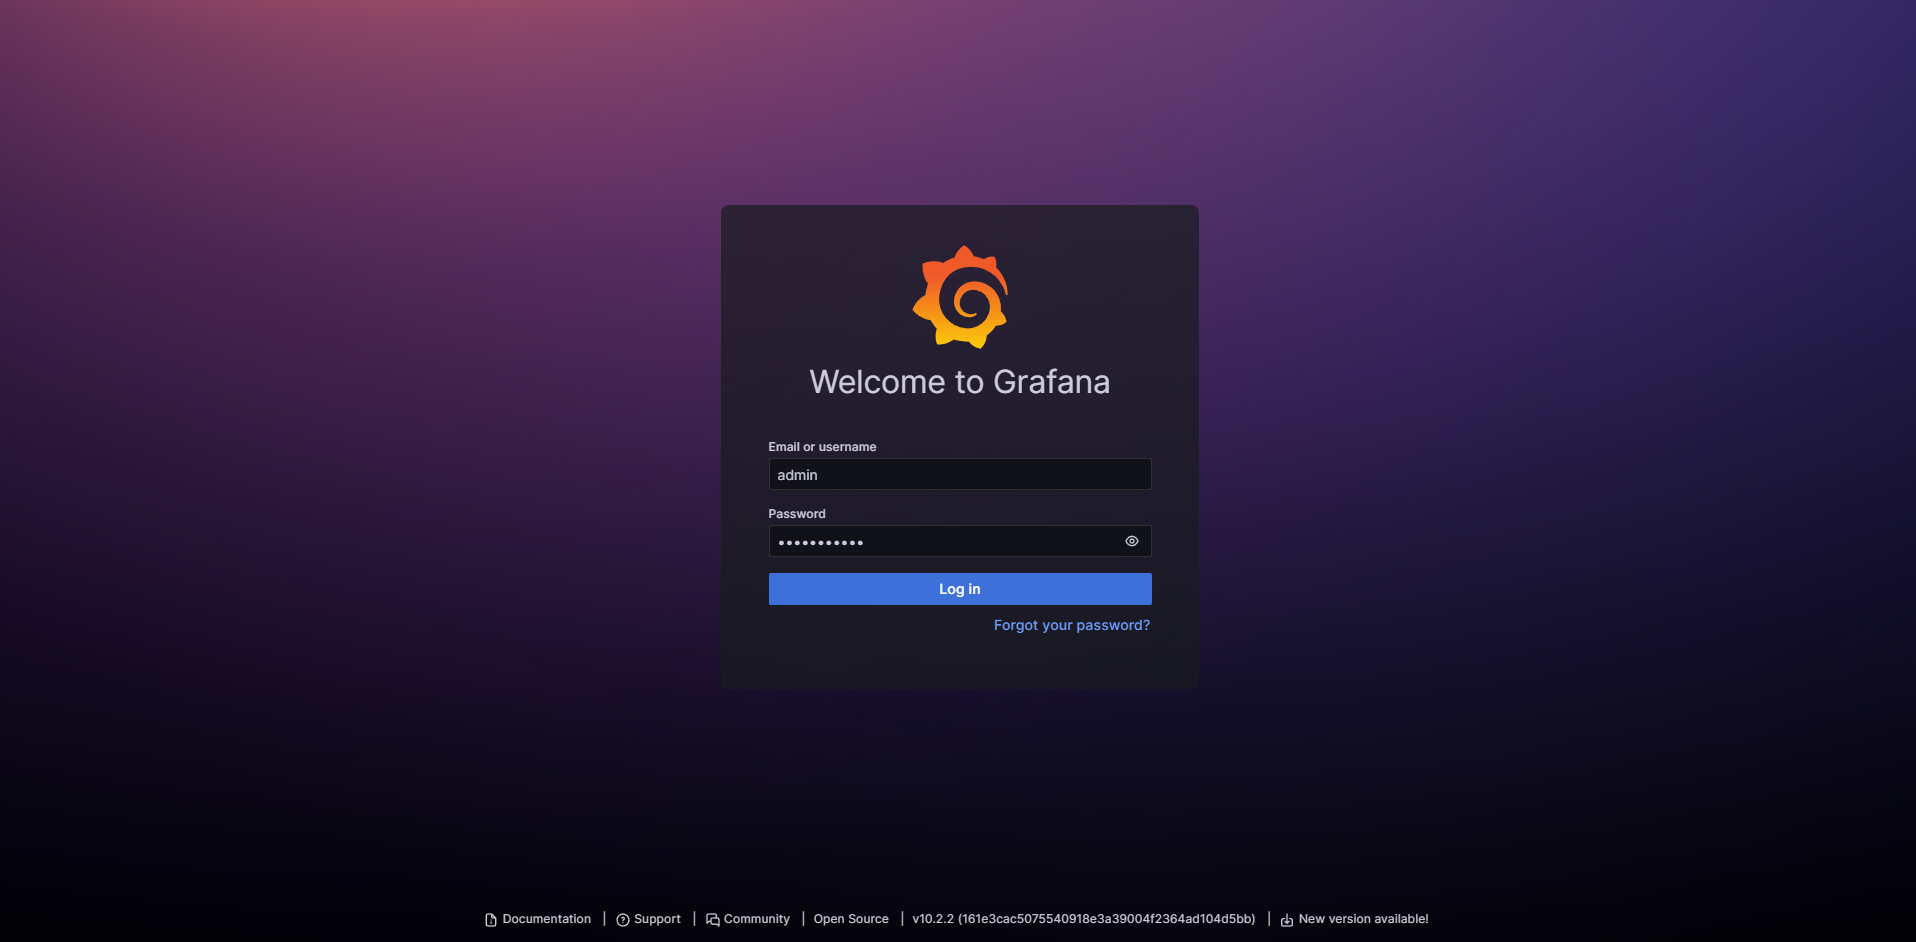
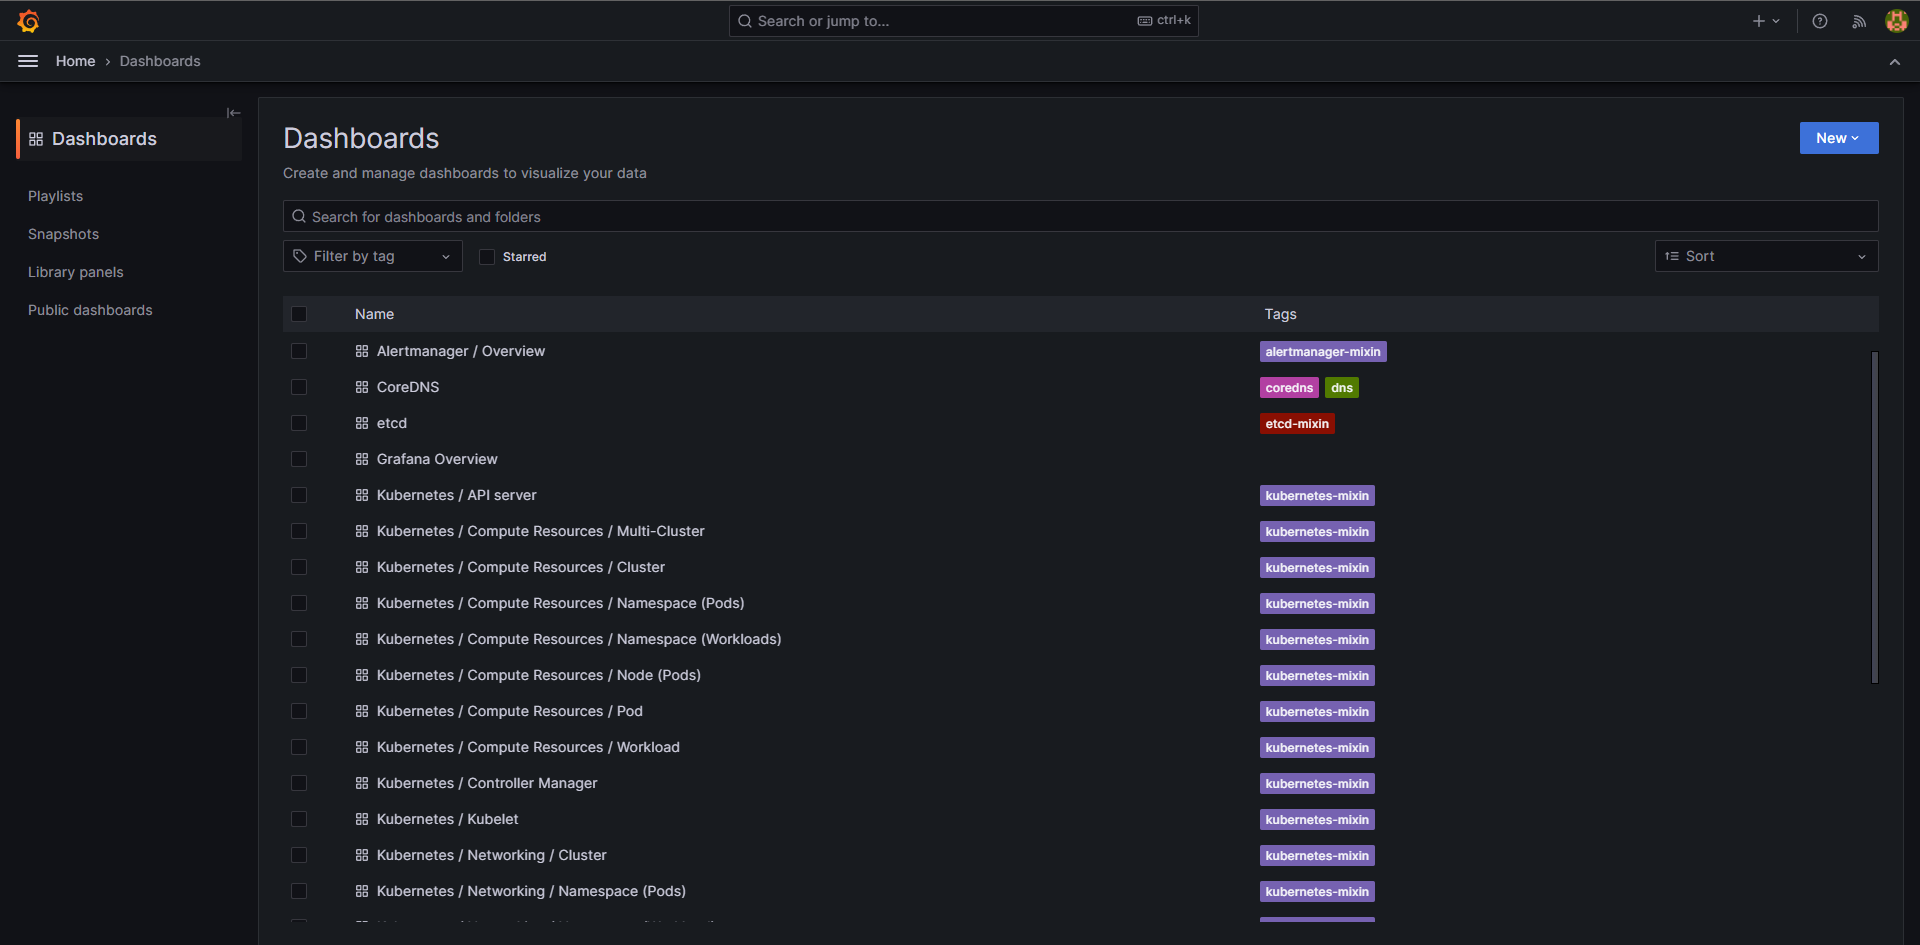
That's it. You are done. Visit the hostname and login to see your dashboard in action. The username is admin.
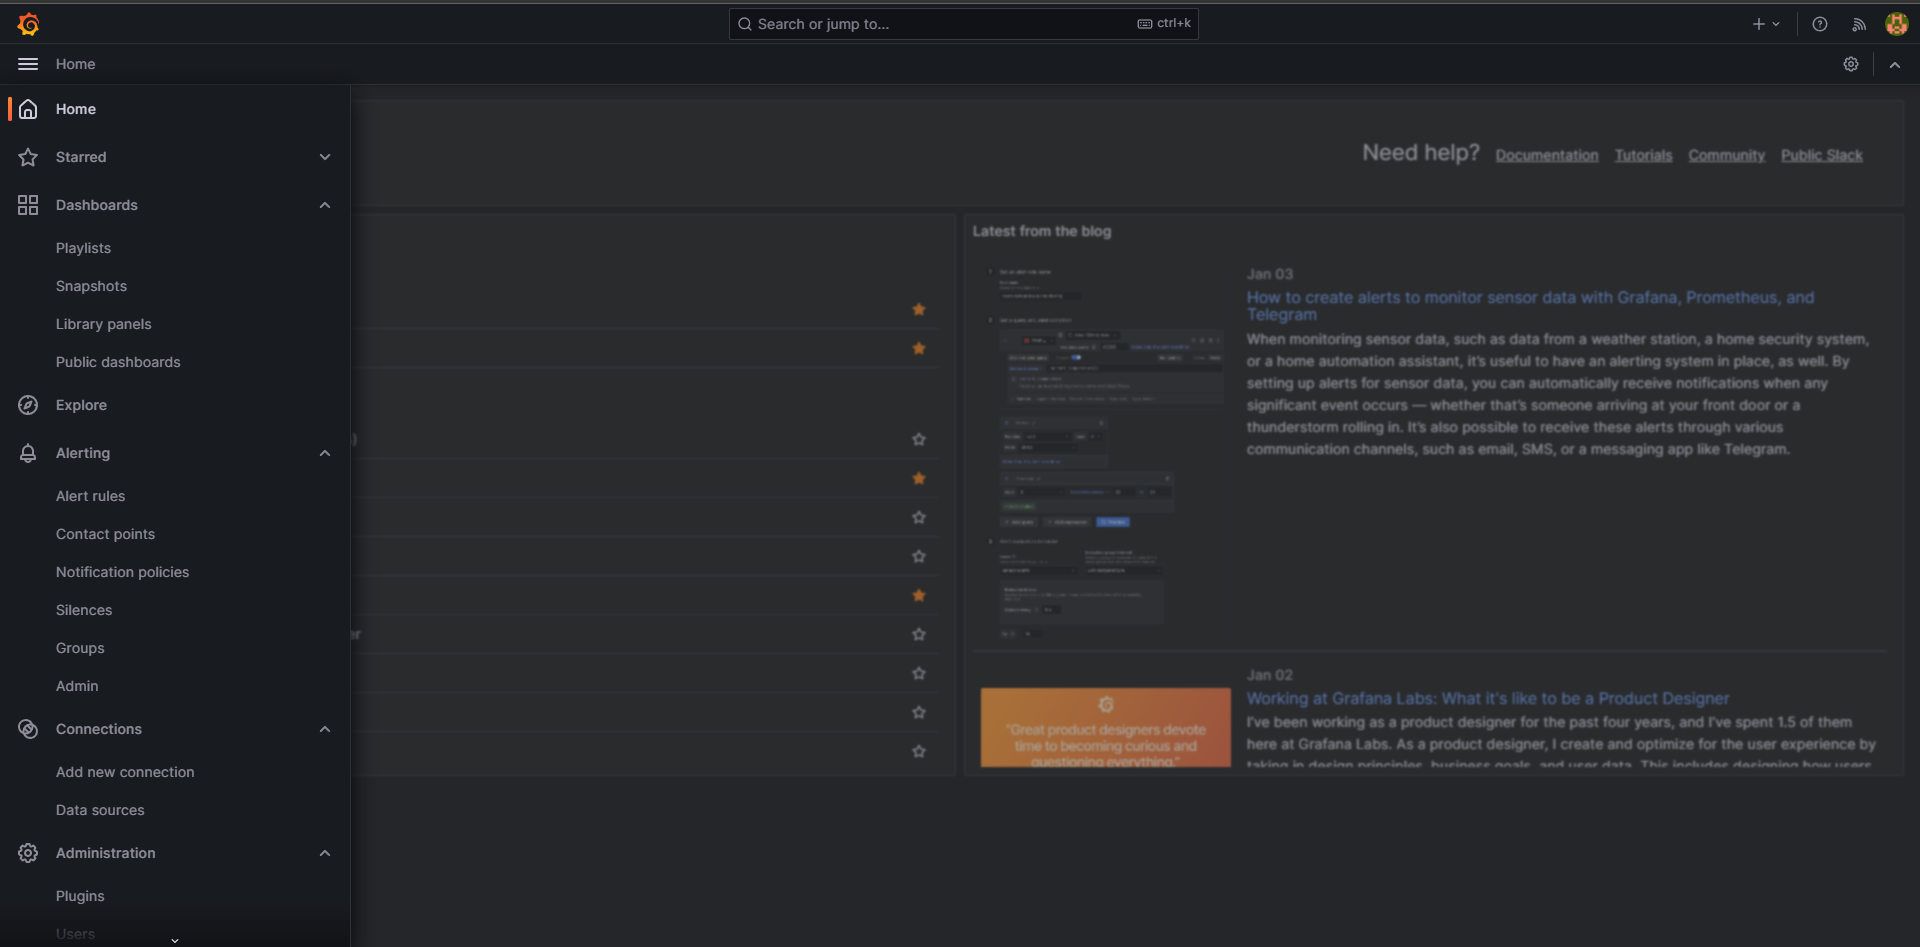

Congrats on reaching this point! It's like we've set up the canvas, but guess what? There's a whole gallery of possibilities waiting for you. Thought about adding more Prometheus exporters, like the Prometheus Postgres Exporter? Now that's some serious data scraping and visualizing.
And hold on, the adventure doesn't end here. Imagine throwing Loki into the mix to gather logs and display them right here. This setup is just the tip of the iceberg. Consider it your launchpad, and in my next posts, I'll guide you through visualizing Ingress-Nginx. Stay tuned for more tech adventures!