Exposing Kubernetes: Navigating the Ingress Odyssey

Alright, buckle up – we're delving into the realm of Ingress controllers for Kubernetes, and our weapon of choice is none other than the robust ingress-nginx - community maintained. This powerhouse isn't just a preference; it's a strategic move. Let's dissect the intricacies, discover why it's a top pick, and then seamlessly guide you through the setup and visualize metrics.
The Ingress-Nginx Edge
Ingress-nginx isn't just code; it's a thriving community. Think of it like a lively town square with constant updates, bug fixes, and features—your Ingress controller is part of a dynamic, ever-evolving entity, not just a tool.
Now, features. Ingress-nginx is your Kubernetes Swiss Army knife. SSL/TLS termination, WebSocket magic, URL rewriting mastery, and custom error page crafting—it's your all-in-one tech arsenal, ready for any deployment scenario.
No language barriers here either. ingress-nginx converses fluently in Kubernetes dialect. The seamless integration with the standard Ingress resource means you can leverage familiar syntax, making your routing configurations a breeze.
Crafting the Ingress-Nginx Tapestry
Step 1: Helm Arrival
Install Helm for a smoother journey.
curl -fsSL -o get_helm.sh https://raw.githubusercontent.com/helm/helm/main/scripts/get-helm-3

chmod 700 get_helm.sh

./get_helm.sh
Step 2: Navigating the Territory
craft your custom config file, ingress-conf.yml . The nodeSelector pinpoints the chosen node for controller deployment, acting as your entry point. I will be rolling with hostNetwork mode, exposing nginx directly without serviceLB as I do not have any external LoadBalancers.
controller:
  kind: DaemonSet
  nodeSelector:
    kubernetes.io/os: "linux"
  service:
    type: "ClusterIP"
  hostNetwork: true
  hostPort:
    enabled: true
    http: 80
    https: 443
  dnsPolicy: ClusterFirstWithHostNet
  resources:
    requests:
      cpu: 100m
      memory: 256Mi
  metrics:
    enabled: true
    serviceMonitor:
      enabled: true
    additionalLabels:
      release: "prometheus"
  extraArgs:
    report-node-internal-ip-address: true
  config:
    use-forwarded-header: "false"
    enable-real-ip: "true"
    forwarded-for-header: "X-Forwarded-For"
    compute-full-forwarded-for: "true"
ingress.yml
The metrics properties will be instrumental in visualizing data later using Grafana and Prometheus.
Step 3: The Coronation Ceremony
helm upgrade --install ingress-nginx ingress-nginx \
  --repo https://kubernetes.github.io/ingress-nginx \
  --namespace ingress-nginx --create-namespace \
  --values ~/ingress.yml
idempotent ver, will install or upgrade
A coronation fit for royalty – ingress-nginx is now ruling your domain.
Step 4: Sentinel Check
Ensure your champions (pods) are standing tall:
kubectl get pods -n ingress-nginxStep 5: Cartography of the Ingress
Craft an Ingress resource – a map of routes for your applications. Behold the scroll, use your own values in host and service
apiVersion: networking.k8s.io/v1
kind: Ingress
metadata:
  name: my-ingress
spec:
  rules:
    - host: myapp.example.com
      http:
        paths:
        - path: /
          pathType: Prefix
          backend:
            service:
              name: myapp-service
              port:
                number: 80
test-ingress.yml
Enact the decree:
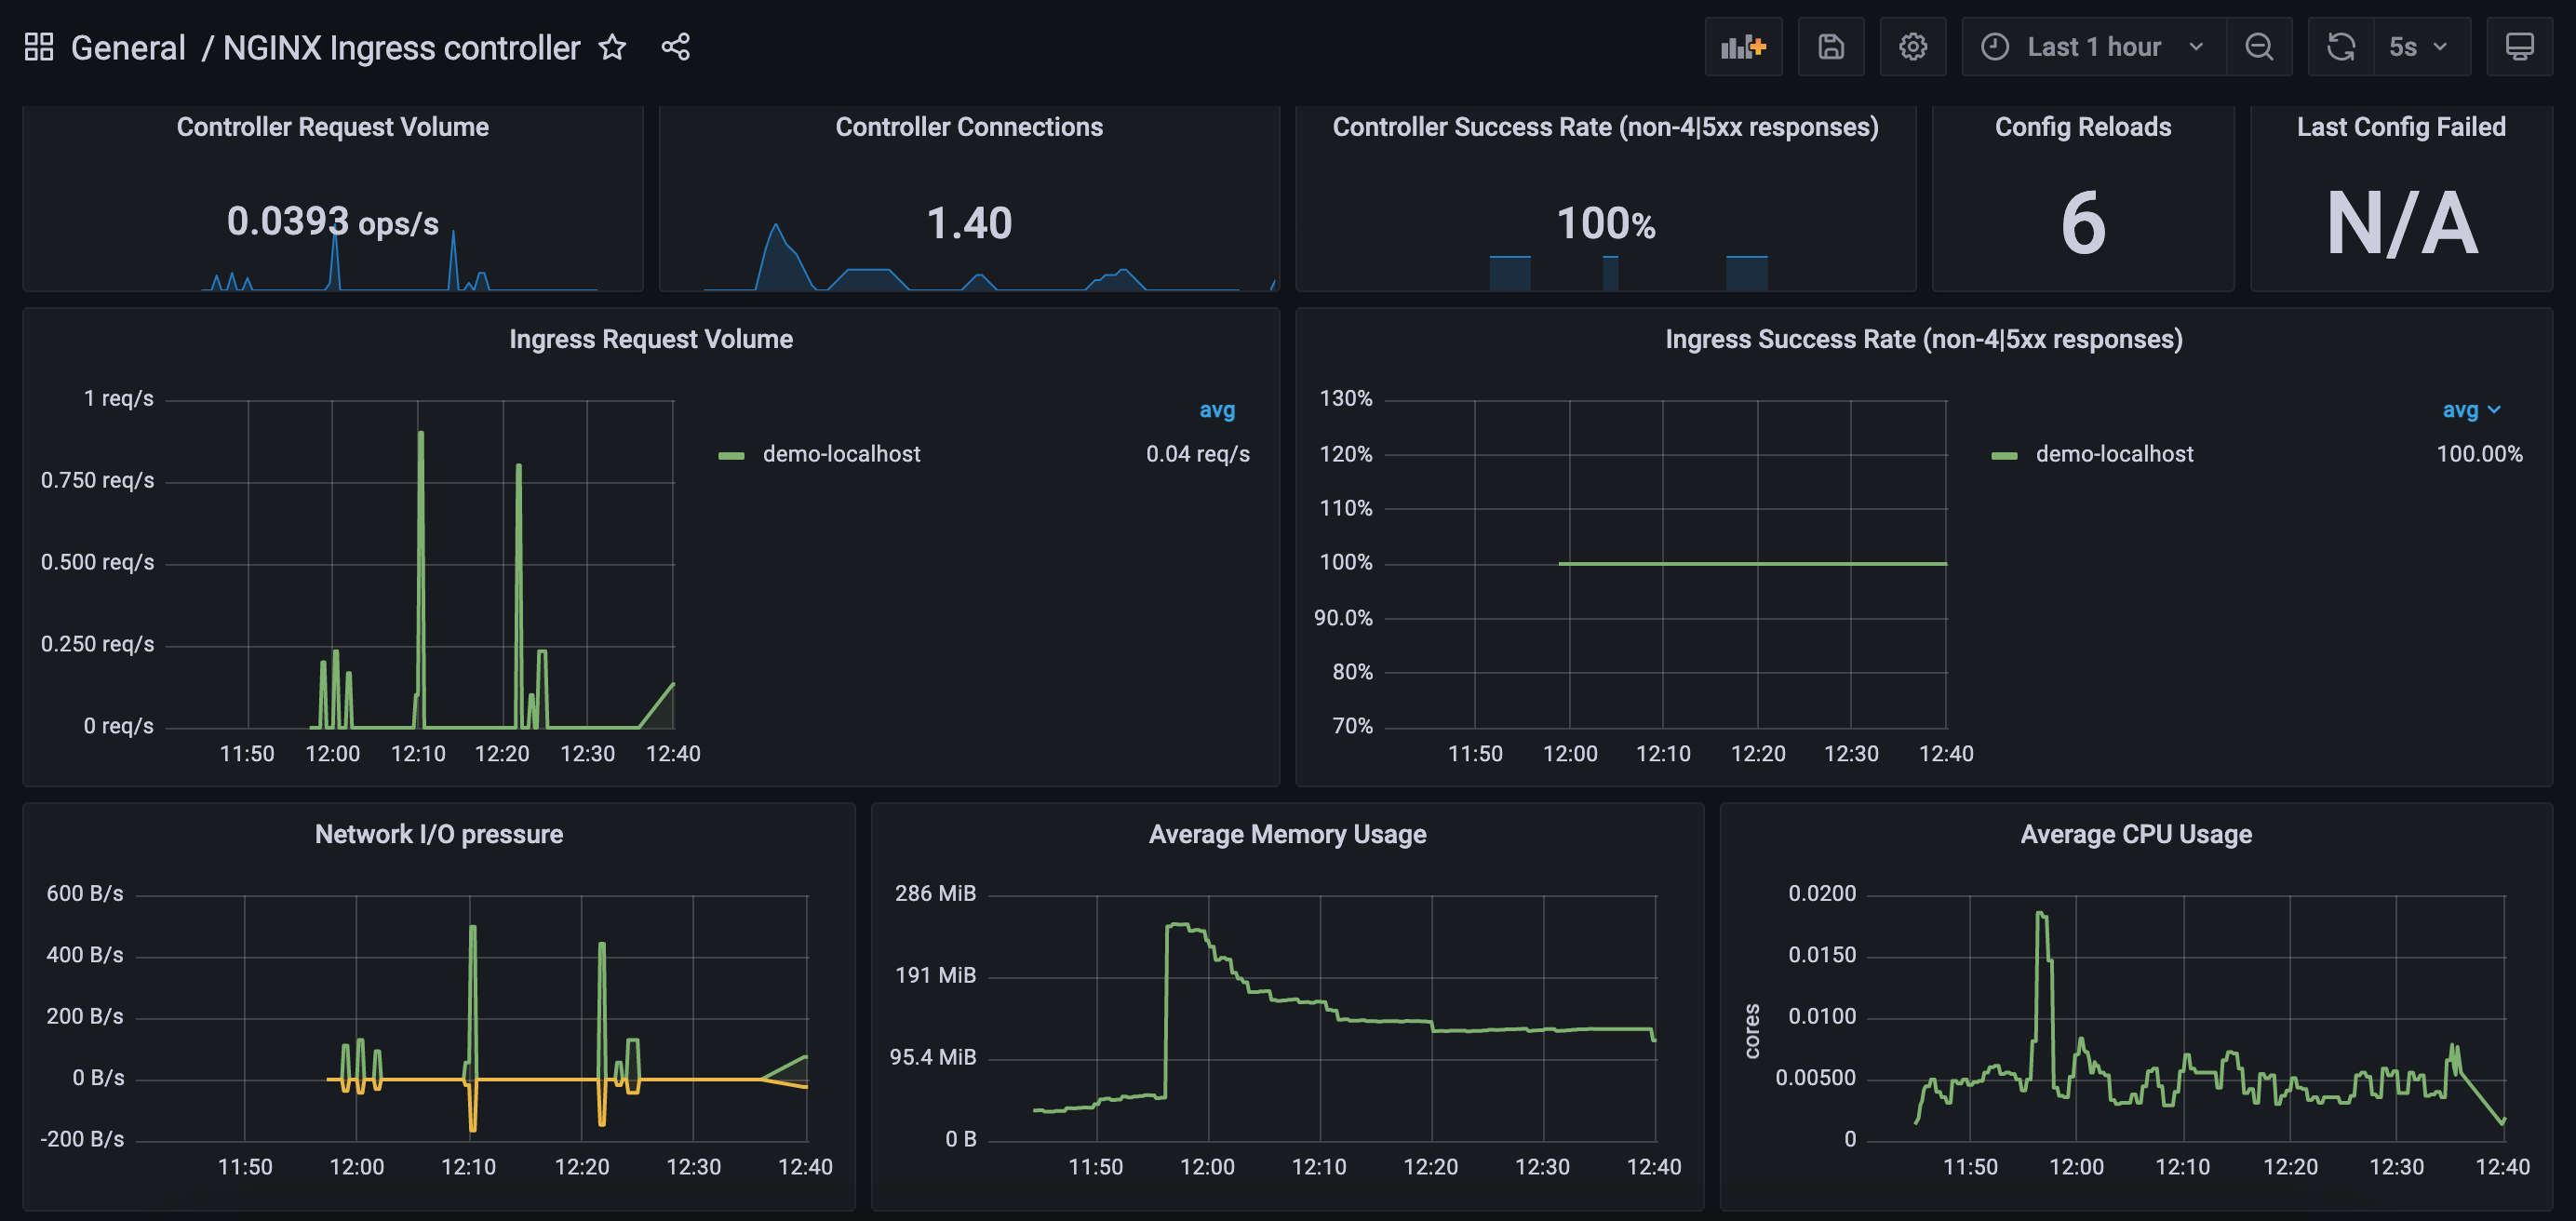
kubectl apply -f test-ingress.ymlWitnessing the Pulse: Real-time Activity Visualization
Make sure you've got that kube-prometheus-stack installed and tuned to perfection—check my previous post for the lowdown. Now, kick back and log into your Grafana panel. To import the Grafana dashboard like a pro, follow the steps I'm about to drop on you. Ready? Here we go!
- Navigate to lefthand panel of grafana
- Hover on the gearwheel icon for Configuration and click "Data Sources"
- If No source configured, Click "Add data source"
- Select "Prometheus" if not selected already
- Left menu (hover over +) -> Dashboard
- Click "Import"
- Enter the copy pasted json from
https://raw.githubusercontent.com/kubernetes/ingress-nginx/main/deploy/grafana/dashboards/nginx.json - Click Import JSON
- Select the Prometheus data source
- Click "Import"
The Final Flourish
Setting up ingress-nginx is akin to orchestrating a symphony. With its community spirit, feature-rich allure, and Kubernetes compatibility, it rises as a preferred choice for many. Yes, it may demand a bit more finesse in the customization arena, but the advantages it unfolds outweigh the intricacies. Prepare to unveil a Kubernetes realm where ingress-nginx reigns supreme!