Unleashing Loki: Taming Logs in Kubernetes
Greetings, code warriors! Brace yourselves for a tech adventure. Today, we're exploring Loki, the log-aggregation maestro crafted to untangle your app's log mayhem. Fasten your seatbelts as we walk through setting up Loki in a K3s self-hosted cluster. It's the next chapter in my kube-prometheus-stack saga. Ready? Let's roll.
Unlike other logging systems, Grafana Loki is built around the idea of only indexing metadata about your logs: labels (just like Prometheus labels). Log data itself is then compressed and stored in chunks in object stores such as S3 or GCS, or even locally on the filesystem. A small index and highly compressed chunks simplifies the operation and significantly lowers the cost of Loki.
Prepare for Loki's conquest in your Kubernetes realm. Verify a running Kubernetes cluster, wield Helm >=3 (the Kubernetes package manager), and have your trusty terminal by your side. Don't forget the coffee—tech's spartan gods insist on it.
Loki Deployment Modes
- Simple Scalable Mode:
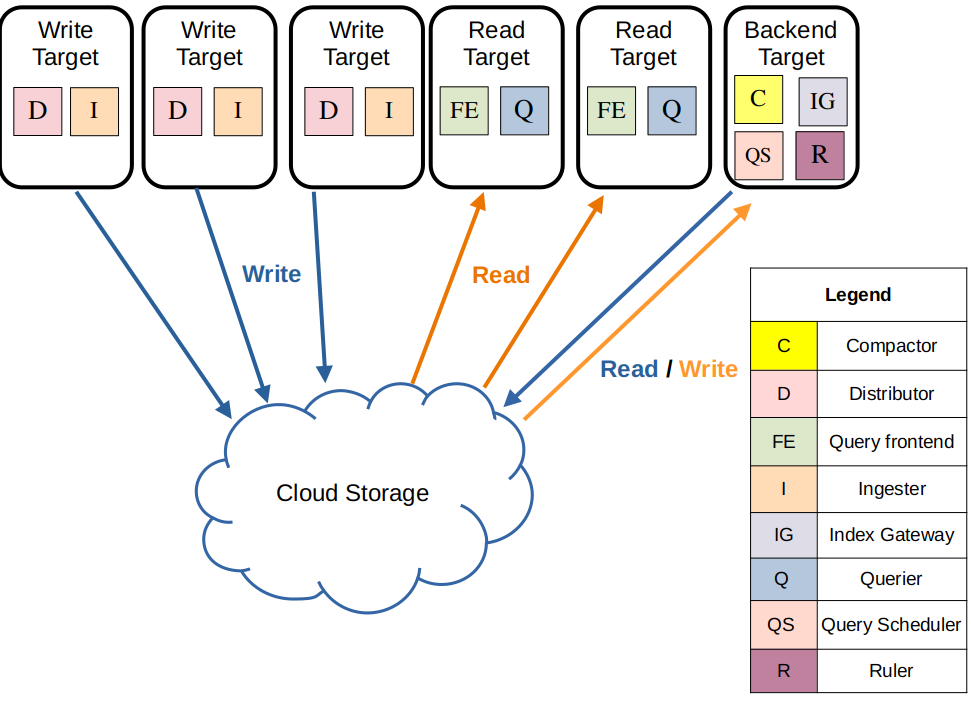
Loki’s simple scalable deployment mode separates execution paths into read, write, and backend targets. These targets can be scaled independently, letting you customize your Loki deployment to meet your business needs for log ingestion and log query so that your infrastructure costs better match how you use Loki. The simple scalable deployment mode can scale up to a few TBs of logs per day
- Monolithic Mode

The simplest mode of operation is the monolithic deployment mode. This mode runs all of Loki’s microservice components inside a single process as a single binary or Docker image. It is good for upto 100GB of logs per day.
- Microservices Mode
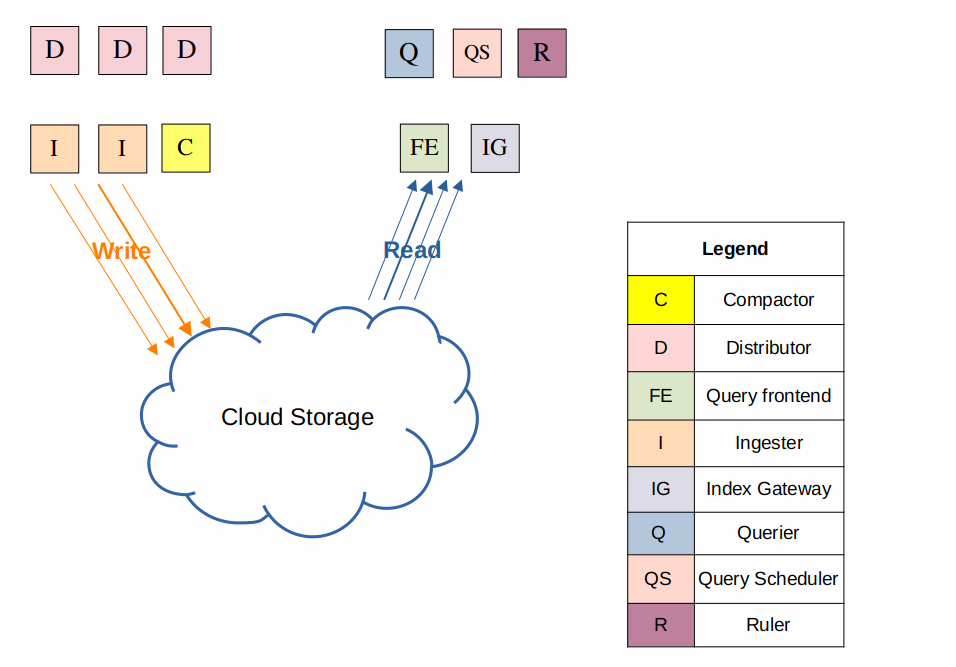
The microservices deployment mode runs components of Loki as distinct processes, allowing limitless scale.
Summoning the Log Sleuth:
Steering clear of unnecessary complexities, I'm opting for the monolithic Loki setup, fine-tuning it precisely for my needs. Rolling with Loki version 2.8 or higher, I'll stick to the recommended TSDB and local file storage, giving object storage the subtle nod of avoidance. Because, really, who needs excess baggage? Keep it lean, keep it efficient.
- Helm Up!: Add the Grafana chart repository:
helm repo add grafana https://grafana.github.io/helm-chartsadding grafana charts to your helm repo
- Loki Configuration: Channel your inner Norse god and tweak Loki's config to your liking.
deploymentMode: SingleBinary
loki:
  auth_enabled: false
  commonConfig:
    replication_factor: 1
  storage:
    type: "filesystem"
  storage_config:
    tsdb_shipper:
      active_index_directory: "/var/loki/tsdb-index"
      cache_location: "/var/loki/tsdb-cache"
      cache_ttl: 24h
  schemaConfig:
    configs:
      - from: 2024-01-01
        store: tsdb
        object_store: filesystem
        schema: v13
        index:
          prefix: loki_index_
          period: 24h
  # tsdb needs this configuration
  query_scheduler:
    max_outstanding_requests_per_tenant: 32768
  # 15 days retention, enforced by compactor
  limits_config:
    retention_period: 360h
  compactor:
    working_directory: "/var/loki/retention-compactor"
    compaction_interval: 10m
    retention_enabled: true
    retention_delete_delay: 2h
    retention_delete_worker_count: 150
    delete_request_store: "filesystem"
    compactor_ring:
      kvstore:
        store: inmemory

  rulerConfig:
    # File path to store temporary rule files.
    rule_path: "/tmp/loki/rules"
    wal:
      dir: "/var/loki/ruler-wal"
    # Configures backend rule storage for a local file system directory.
    storage:
      type: "local"
      local:
        directory: "/var/loki/rules"
    ring:
      kvstore:
        store: inmemory
    enable_api: true
    enable_alertmanager_v2: true
    alertmanager_url: http://alertmanager.monitoring:9093

singleBinary:
  replicas: 1
  resources:
    limits:
      cpu: 1
      memory: 6Gi
    requests:
      cpu: 0.5
      memory: 2Gi
  nodeSelector:
    region: "australia"
    kubernetes.io/os: "linux"
  persistence:
    enabled: true
    enableStatefulSetAutoDeletePVC: true
    size: 10Gi
    storageClass: "local-path"
    accessModes:
      - ReadWriteOnce

read:
  replicas: 0
backend:
  replicas: 0
write:
  replicas: 0

ingress:
  enabled: false
gateway:
  enabled: false

test:
  enabled: false
lokiCanary:
  enabled: false

# memcache auto deployed, to disable =>
chunksCache:
  enabled: false

resultsCache:
  enabled: false
loki-monolith.yml, to be used for loki installation
No need to showcase Loki to the world, so no Ingress. Since it's a monolith, no internal request load balancing either - hence, no gateway. No expert moves here; just lots of doc reading, multiple trial and error rounds, and a scenic tour through GitHub issues. This setup is my victory dance. For a deeper dive into configurations, the official chart doc is the treasure map.
- Unleash the Sleuth: Deploy Loki with Helm , Specify the absolute path when creating the values file, because precision matters.
helm install loki grafana/loki --namespace monitoring --values path/to/loki-monolith.ymlloki installation using helm
- Let the Logs Flow: Deploy Promtail on your kubernetes nodes—Loki's trusty sidekick. It discovers targets, scrapes logs from your apps, attaches labels and sends them to the Loki instance. Config is a breeze, with a default Daemonset. The URL resolves locally since both run in the same namespace,
monitoring.

resources:
  limits:
    cpu: 100m
    memory: 512Mi

config:
  clients:
    - url: http://loki:3100/loki/api/v1/push
promtail.yml, to be used as values for promtail helm installation
helm install promtail grafana/promtail --namespace monitoring --values path/to/promtail.ymlpromtail installation command
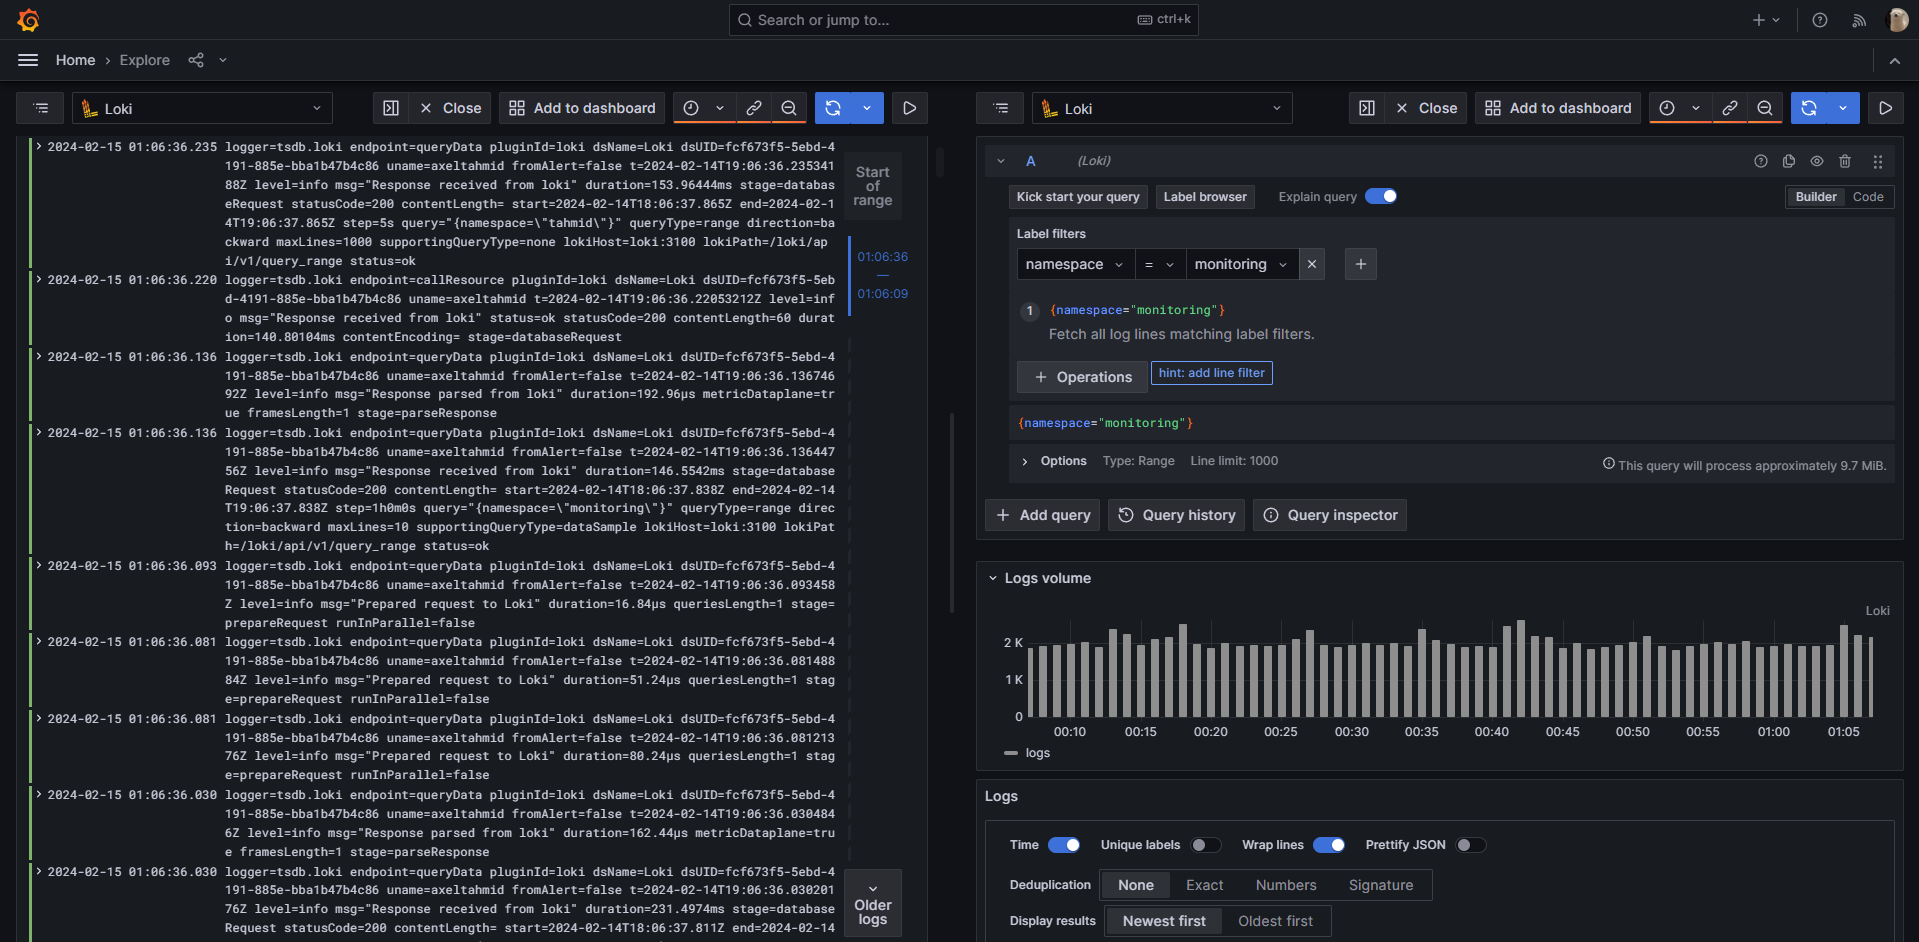
- Grafana is Your Watson: Loki integrates seamlessly with Grafana, giving you a powerful dashboard to visualize and analyze your logs. Write LogQL queries (think Sherlock's deductions) to uncover hidden patterns and troubleshoot issues.
In a prior post, I covered setting up Kube-Prometheus-Stack. I'll reuse those values but integrate Loki as a datasource for Grafana.
# previous configs..
grafana:
  # other configs..
  # .........
  additionalDataSources:
    - name: Loki
      type: loki
      access: proxy
      url: http://loki:3100/
      isDefault: false
      manageAlerts: true
That's a wrap! Now, with Grafana, I can seamlessly query for logs, using the built in visual query builder, allowing me to query Namespaces, Containers or basically any labels. Thanks for joining me on this journey!
Final Words:
With Loki in your arsenal, your kubernetes cluster's logs become a treasure trove of insights, not a confusing mess. Remember, with great log power comes great responsibility (don't unleash Ragnarok on your storage!). Now go forth, tame those logs, and uncover the secrets they hold!